Your stock trading selections can be greatly impacted by the use of the right tools and indicators. One such powerful indicator is the VWAP, or Volume Weighted Average Price. This technical analysis tool has gained widespread acceptance among traders due to its ability to provide relevant information about price movements and market trends. We’ll talk about the VWAP indicator in this blog post, including its definition, operation, and applications to improve your trading tactics.
What is the VWAP Indicator?
The VWAP Indicator, or Volume Weighted Average Price, is a technical analysis tool that calculates the average price of a security over a specific time period. It takes into account both the price and the volume traded at each price point. Unlike a simple average price, the VWAP gives more weight to prices where higher volume was traded, providing a more accurate representation of the market’s sentiment.
The VWAP Indicator is widely used by traders and investors to identify potential entry and exit points, as well as to figure out the overall strength or weakness of a stock’s price movement.
How Does the VWAP Indicator Work?
The VWAP Indicator is calculated using the following formula:
VWAP = (Sum of Traded Prices x Volume) / Total Volume
To better understand how the VWAP Indicator works, let’s consider an example:
Company XYZ’s stock trades at the following prices and volumes during a trading session:
- 10:00 AM: Price Rs.50, Volume 1,000 shares
- 11:00 AM: Price Rs.52, Volume 2,000 shares
- 12:00 PM: Price Rs.48, Volume 1,500 shares
- 1:00 PM: Price Rs.51, Volume 3,000 shares
To calculate the VWAP for this trading session, we multiply each price by its respective volume, sum these values, and then divide by the total volume traded:
VWAP = [(50 x 1,000) + (52 x 2,000) + (48 x 1,500) + (51 x 3,000)] / (1,000 + 2,000 + 1,500 + 3,000)
VWAP = (50,000 + 104,000 + 72,000 + 153,000) / 7,500
VWAP = 379,000 / 7,500
VWAP = Rs. 50.53
Using the VWAP Indicator for Trading
The VWAP Indicator can be used in various ways to inform your trading decisions. Here are some common strategies:
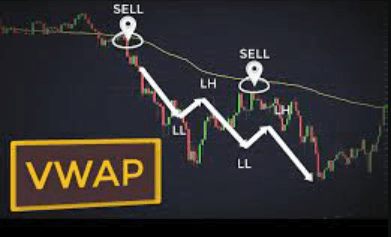
1. Trend Identification: The VWAP can help identify the overall trend of a stock. If the price is trading above the VWAP, it may indicate an uptrend, while a price below the VWAP may suggest a downtrend.
2. Entry and Exit Points: Many traders use the VWAP as a support or resistance level. They may consider buying when the price crosses above the VWAP (in an uptrend) or selling when the price drops below the VWAP (in a downtrend).
3. Intraday Trading: The VWAP can be particularly useful for intraday traders. If the price is trading above the VWAP, it may indicate potential buying pressure, while a price below the VWAP could signal selling pressure.
4. Volume Analysis: By analysing the volume traded at different price levels relative to the VWAP, traders can gauge the strength or weakness of a stock’s price movement.
Read also: All You Need to Know about Share Market
Incorporating VWAP into Your Trading Strategy
Here are some tips for incorporating VWAP into your trading strategy:
- Use in Conjunction with Other Indicators: Combine the VWAP with other technical indicators, such as moving averages, oscillators, or chart patterns, to make more informed trading decisions.
- Adjust the Time Frame: The VWAP can be calculated for different time frames, such as hourly, daily, or weekly. Experiment with different time frames to find the one that best suits your trading style.
- Consider Market Conditions: The effectiveness of the VWAP Indicator may vary depending on market conditions, such as volatility or trading volume. Adjust your strategy accordingly.
Conclusion
The VWAP Indicator is a useful tool for learning valuable information about price movements and market trends. By understanding how it functions, you can potentially increase your trading success by making smarter decisions and implementing it into your trading plan. Keep in mind that even while the VWAP Indicator is a useful tool for traders, you should still combine it with other technical indicators and research methods. If you’re looking for a share market app that includes the VWAP Indicator and other advanced trading tools, consider exploring BlinkX. BlinkX has an intuitive UI, real-time statistics, and customizable settings that can help you make the most of VWAP and advance your trading.